Project Brief
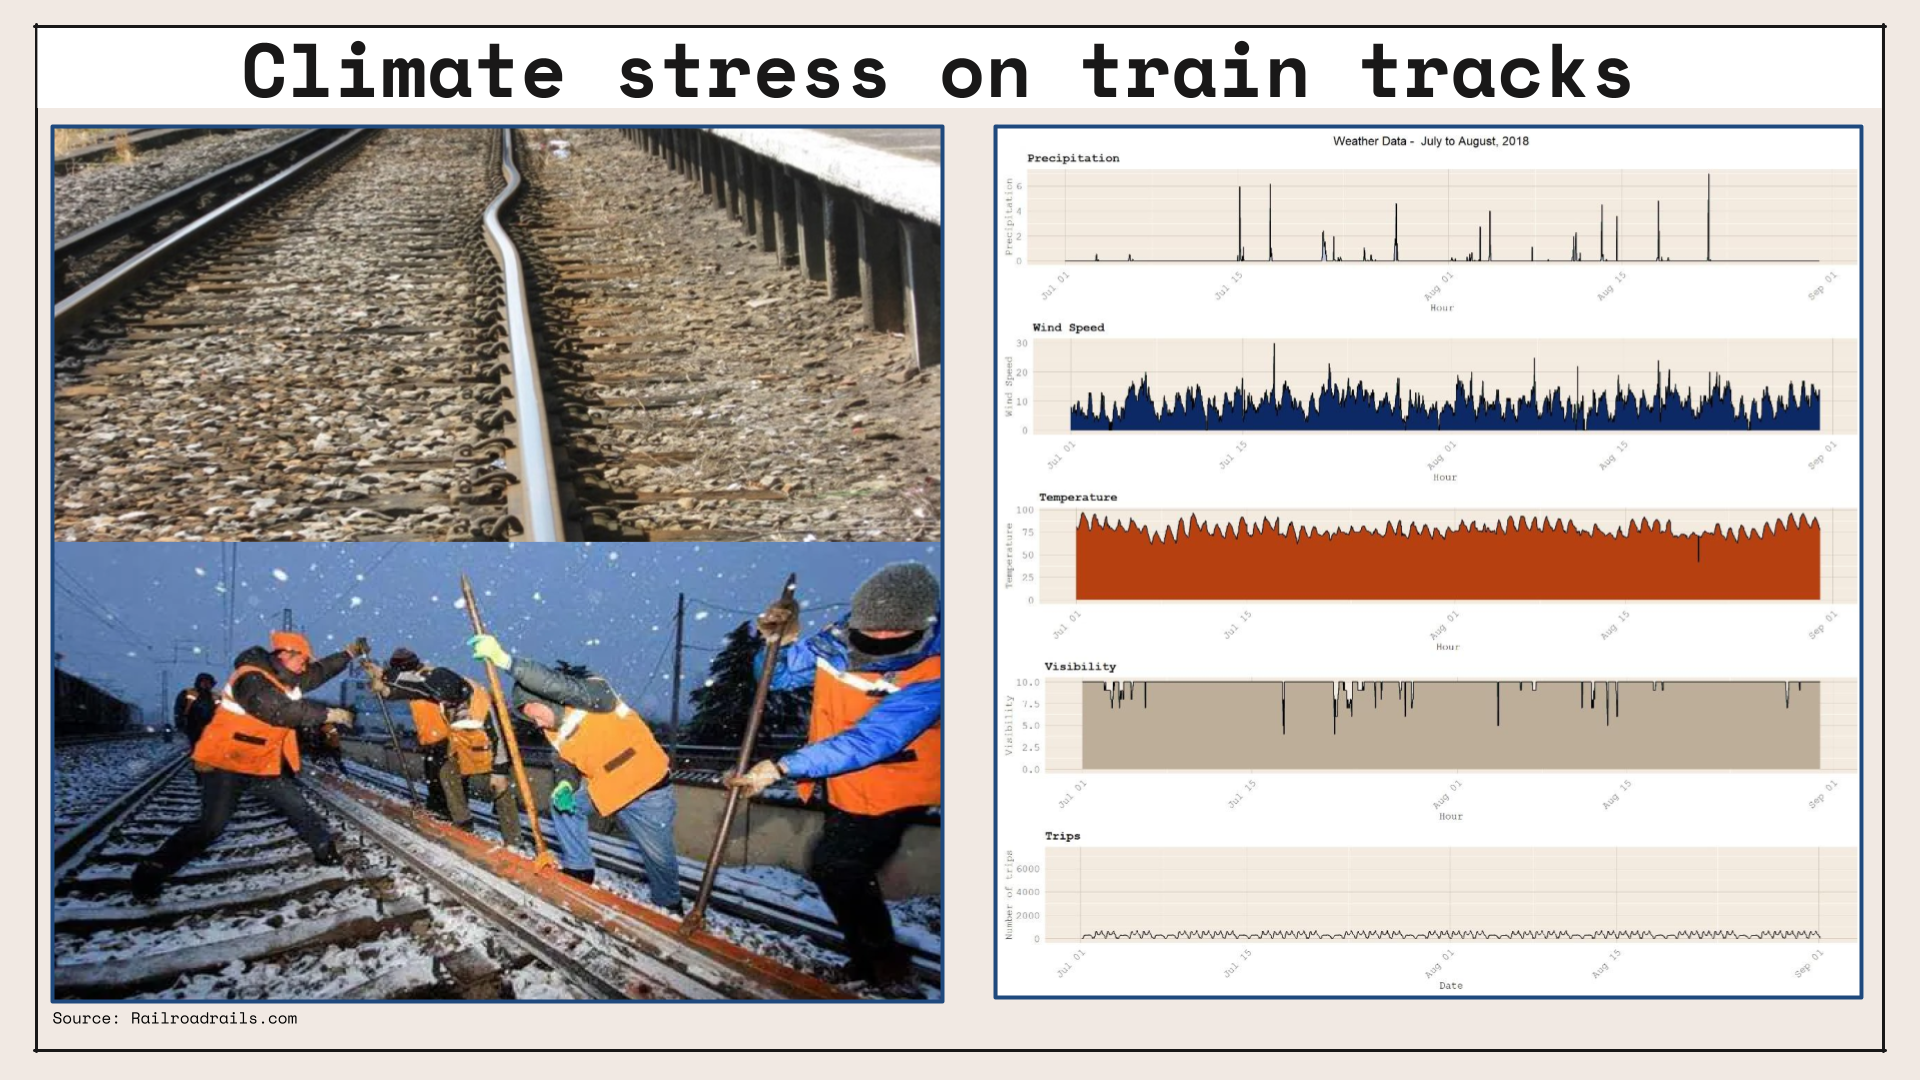
NJ Transit is the primary transit authority in the state of New Jersey and has control over its rail systems and tracks. This project looks into the causes of delays and assumes that most of them might be attributed to climatic conditions. Particularly under very hot and very cold conditions, railways are prone to damages, which we hypothesized will cause more consequential delays that run for a longer period of time, sometimes even causing cancellations. This project explores how addressing and predicting for these delays can help select those tracks that need more maintenance and checks.
We created a government-facing website for NJ transit authority to predict where most train delays will happen to schedule checking, remodeling and upgradation of train tracks in those segments. We hope our forecast models will allow NJ Transit to optimize repair funding more efficiently and prevent delays.
This analysis uses a simple Machine Learning model based on a linear regression, while employing a space-time panel with variables such as station, time, time lag, etc. We see great uses of a similar model in other cities like New York and Philadelphia to help predict for SEPTA and MTA delays to scale.
Exploratory Analysis
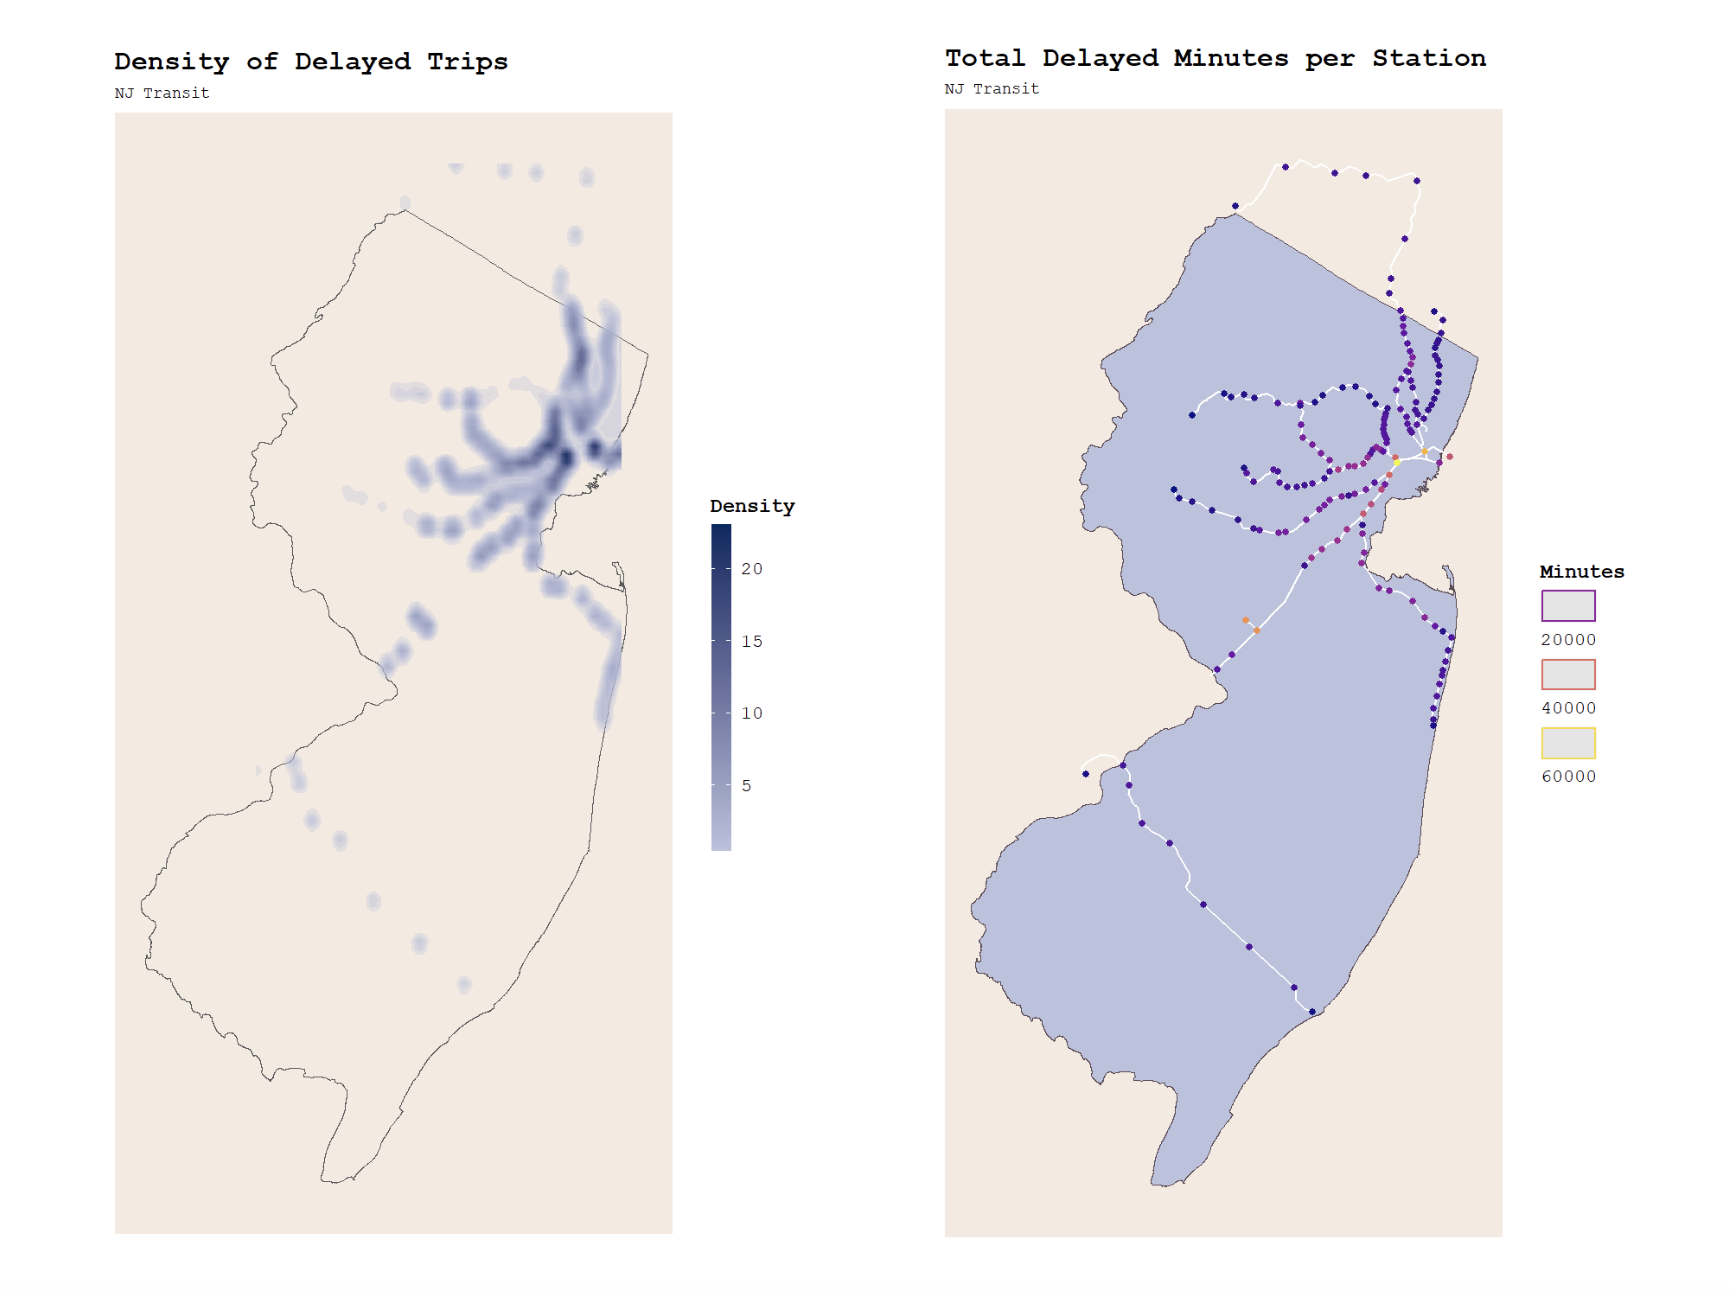
In our exploratory analysis, we conducted various GIS analyses and correlation tests to determine how best to build our prediction model. Our approach focuses on climatic conditions and how they affect delay time. Variables used include wind, temperature, visibility, precipitation, etc.
We created three regression models with different variables, and found our third regression most accurate:
Regression 3 <- lm (delay_minutes ~
station + hour + day of the week
+ Temperature + Precipitation +
Visibility + Wind_Speed + lagHour
+ lag2Hours +lag3Hours +lag12Hours
+ lag1day + holidayLag + holiday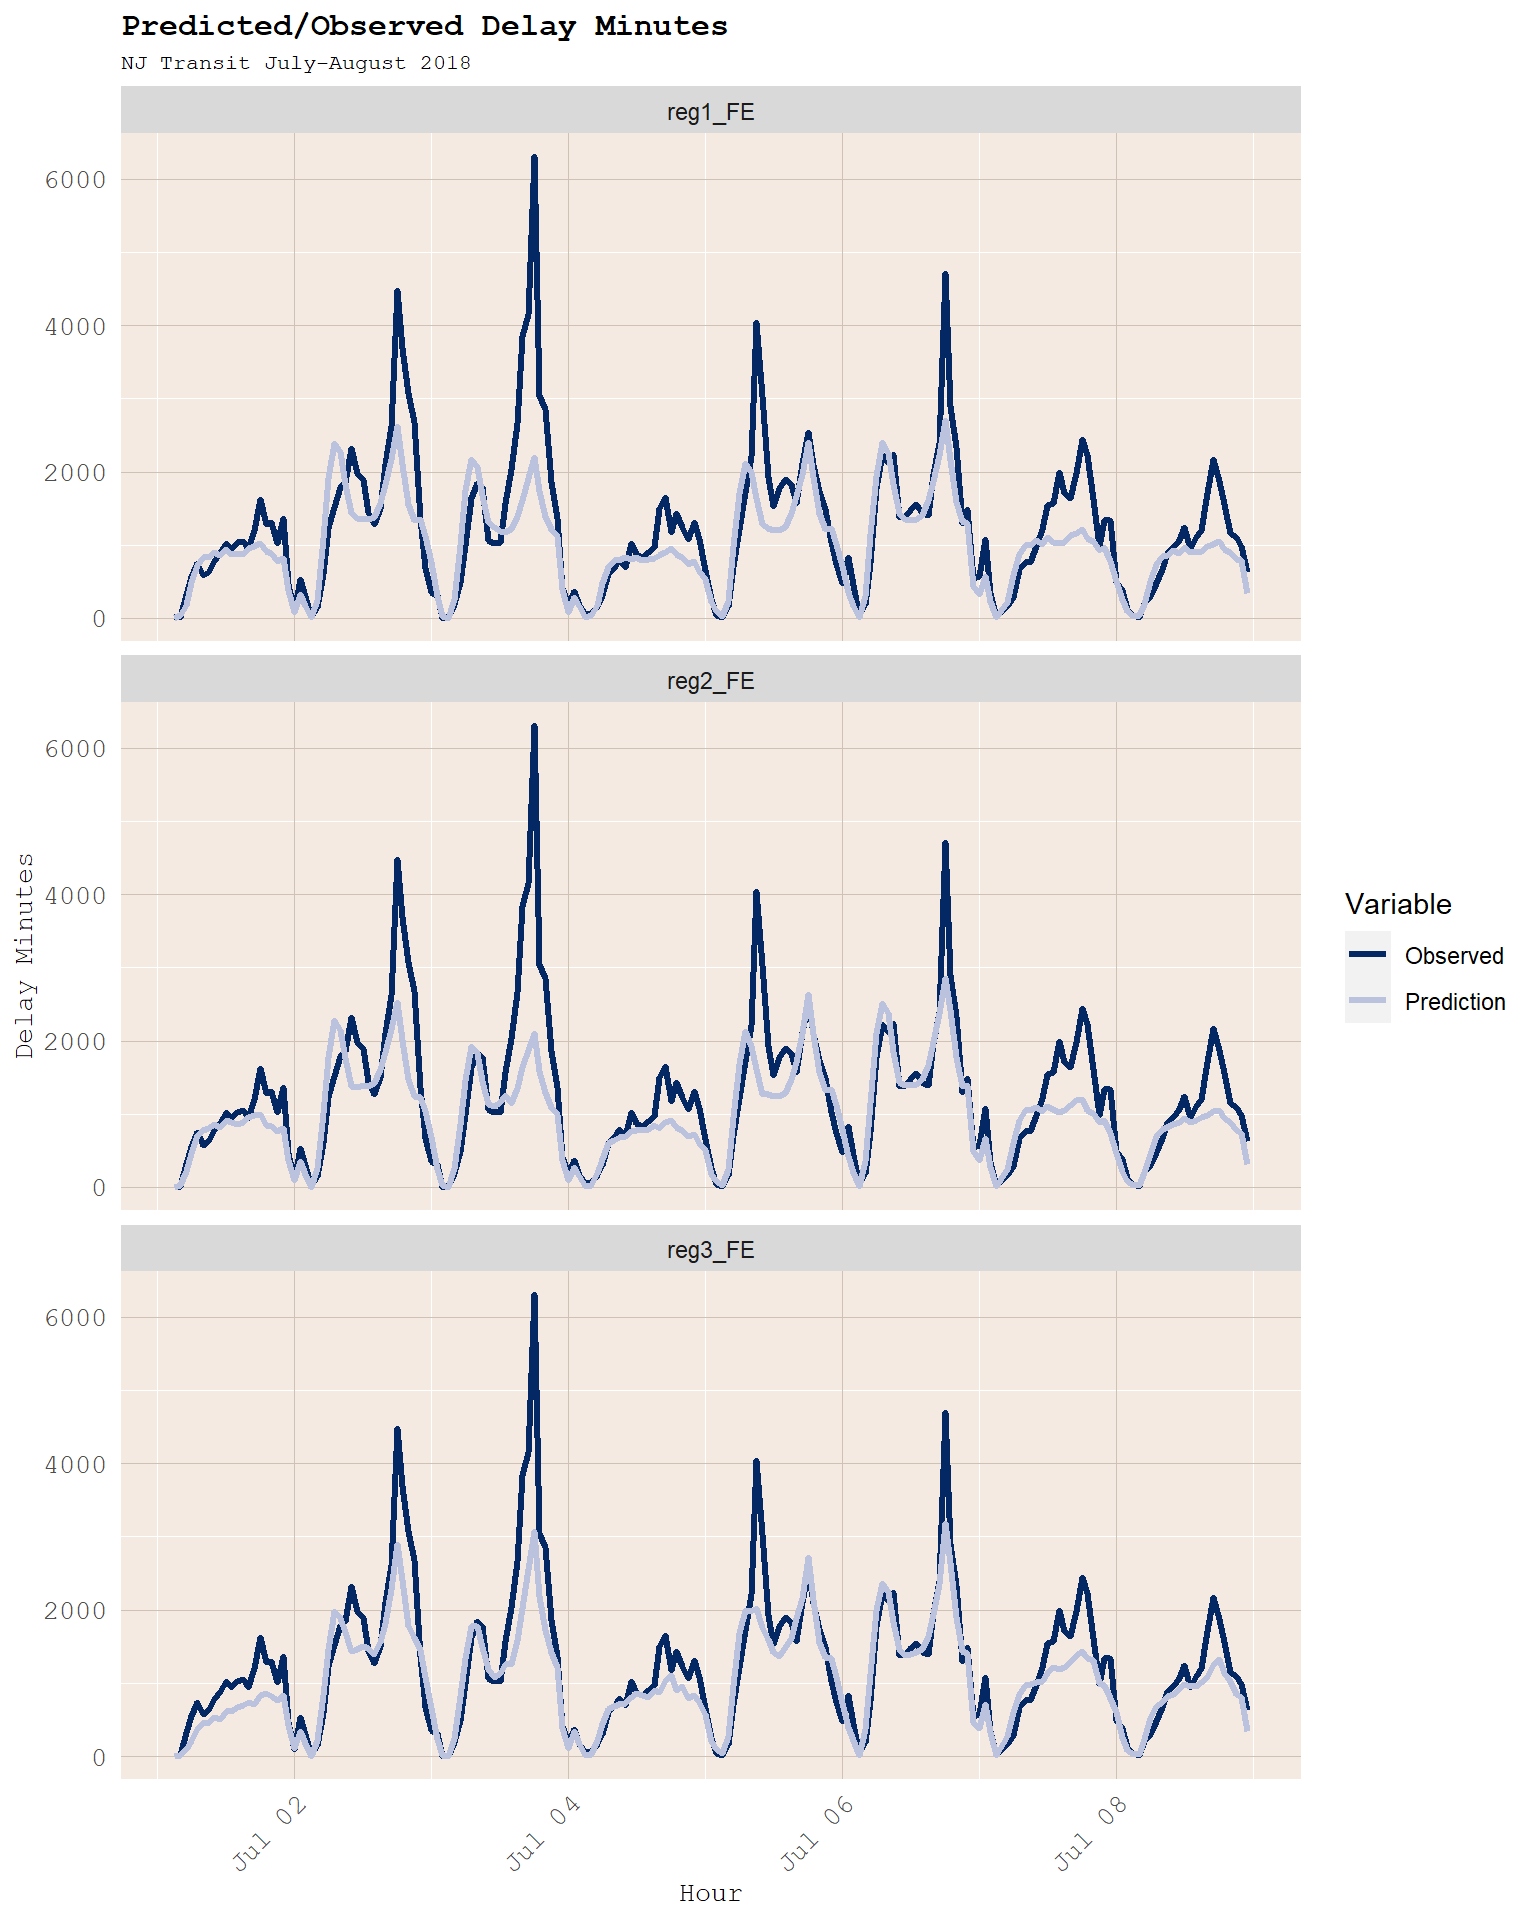
In conclusion, we believe our project is a proactive approach to track maintenance through the lens of delay consequences. It is cost reducing, and can increase resilience and customer satisfaction.
Project Outcomes
The project outcome and use case for this analysis was a prototype website to serve NJ Transit in making decisions on rail upgrades. See more in the presentation video, wireframing website prototype, and full analysis.
Pechakucha Presentation
Website Wireframing using Figma
It is recommended to click into the link or view fullscreen for a better experience of the prototype website.
Full Analysis
Click the full analysis button at the top to view at full screen.