Project Brief
This project aims to help Zillow better predict its housing market predictions through a hedonic model. The project emphasizes on local knowledge, a novel way of looking at the data and creative factors that might enhance predictability of Zillow’s modeling. While Zillow’s model works satisfactorily, this approach offers a different lens into how the model could be built stronger with intel from a variety of internal and external factors, such as amenities like schools, parks, public spaces, as well as demographic data like poverty rates, median income, crime, etc.
In addition to the hedonic model, this project focussed on cross validation through evaluating mean absolute error/percent error and conducting Moran’s I testing. The full analysis and model can be found below or by clicking the Full Analysis link above.
Exploratory Analysis
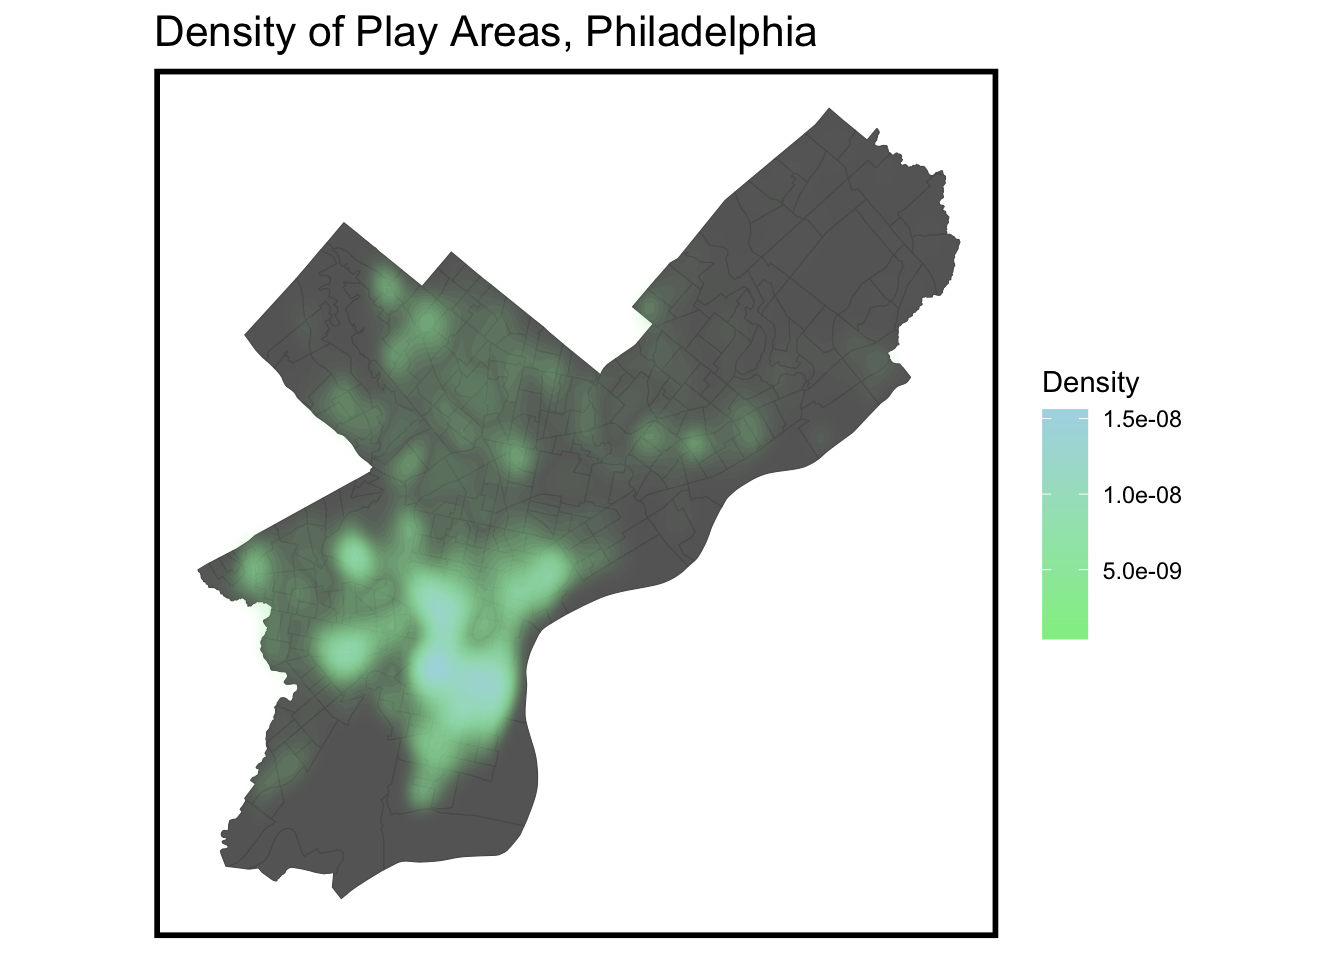
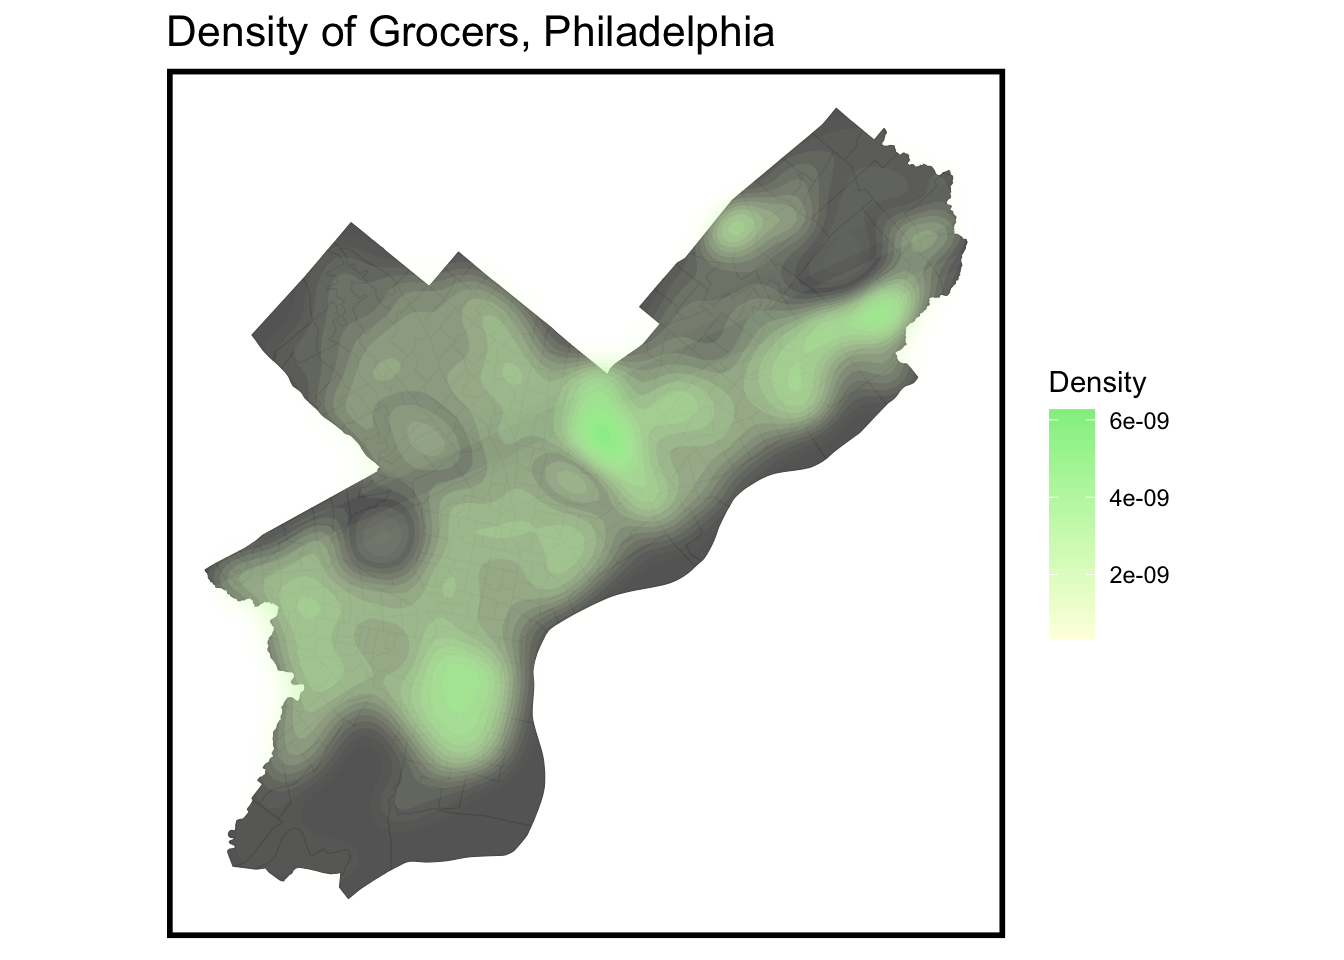
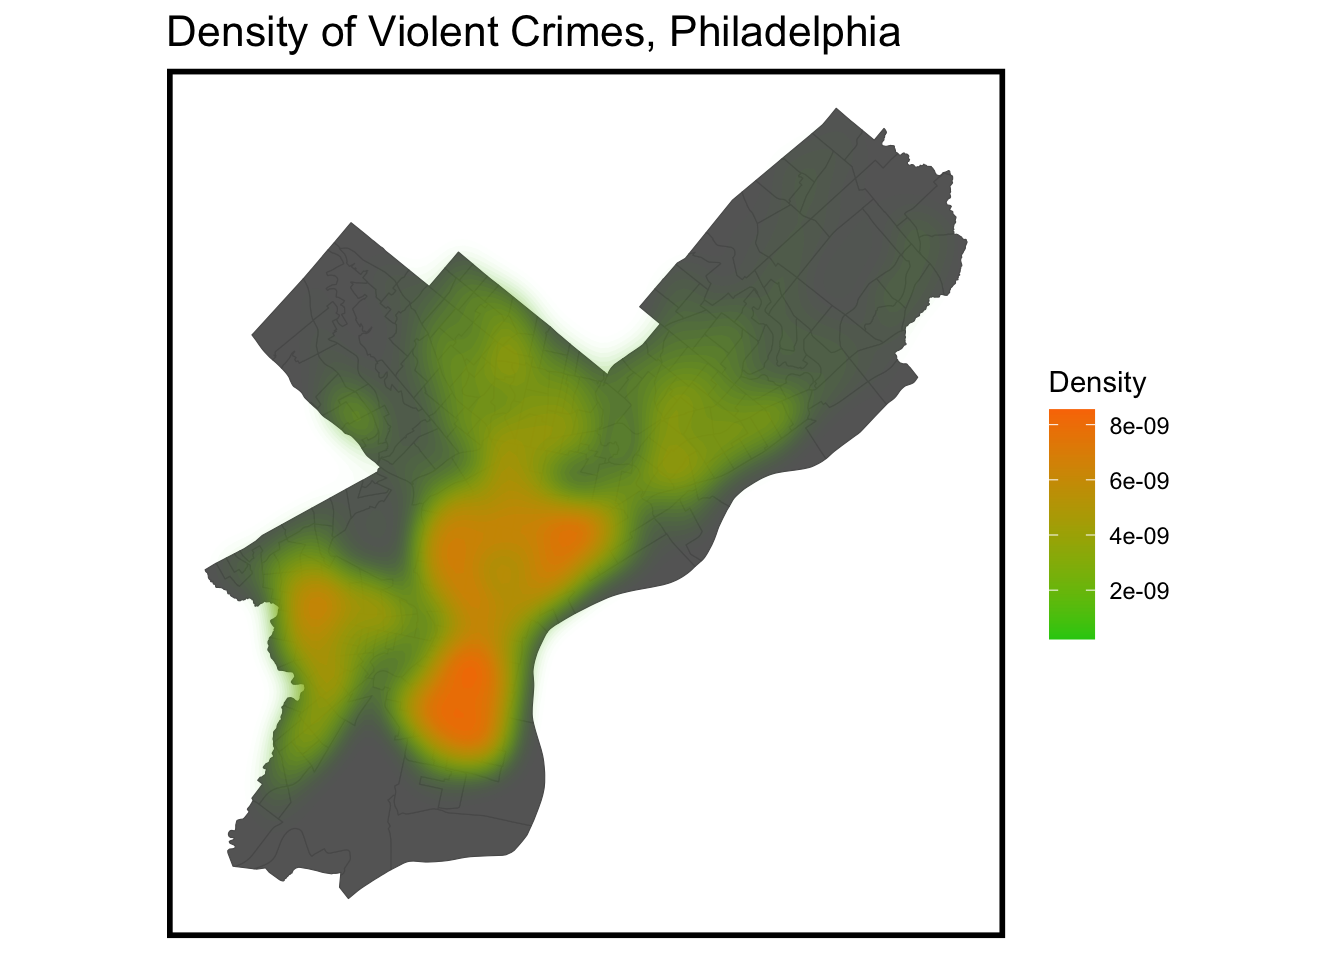
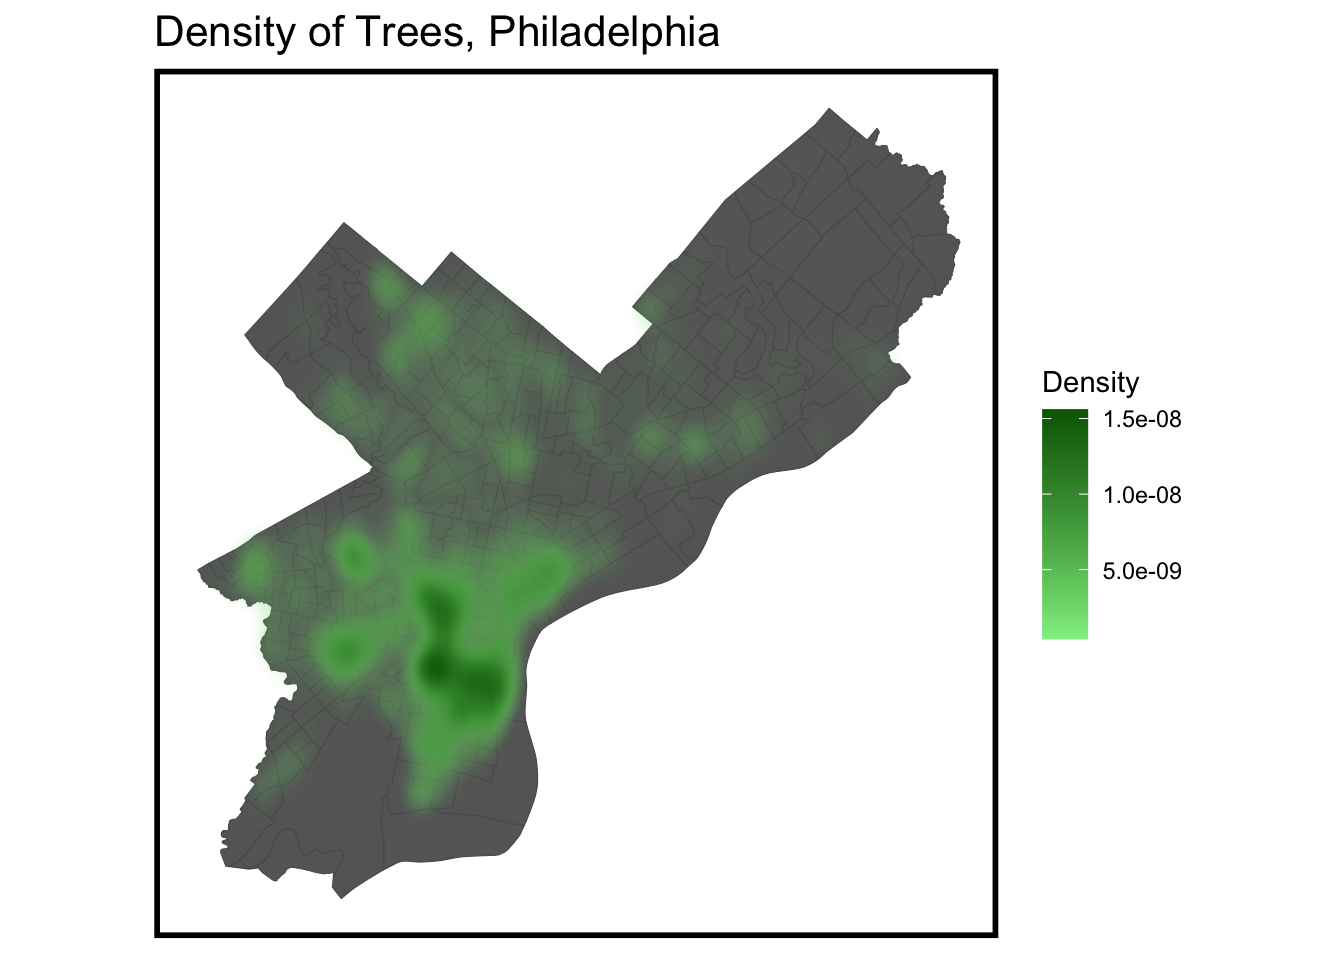
The project conducted a very thorough exploratory analysis with feature engineering on a range of variables. Some external variables are visualized below:
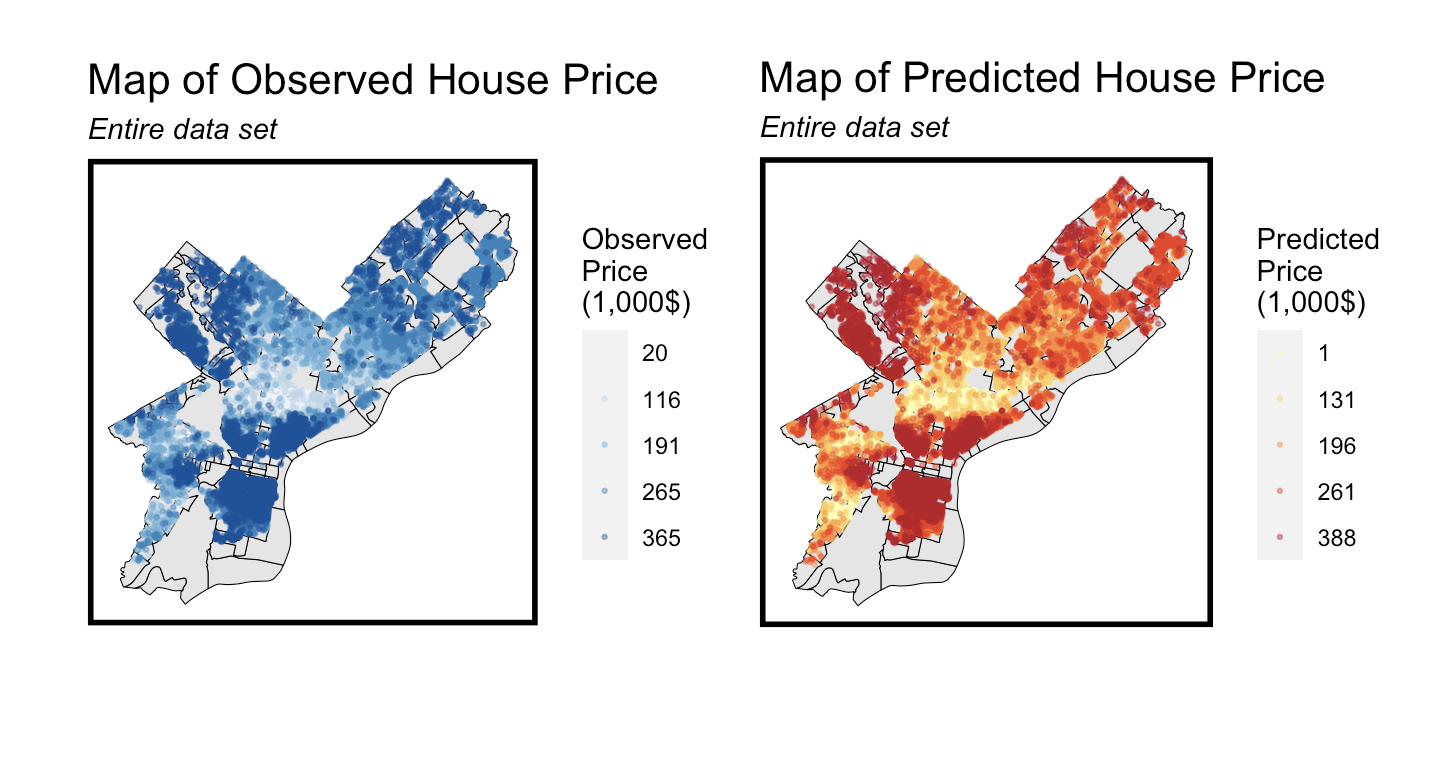
Project Outcome
Click the full analysis button at the top to view at full screen.
Data Sources
- Zillow, wrangled by Michael Fichman here
- OpenDataPhilly
- Census Bureau