Project Brief
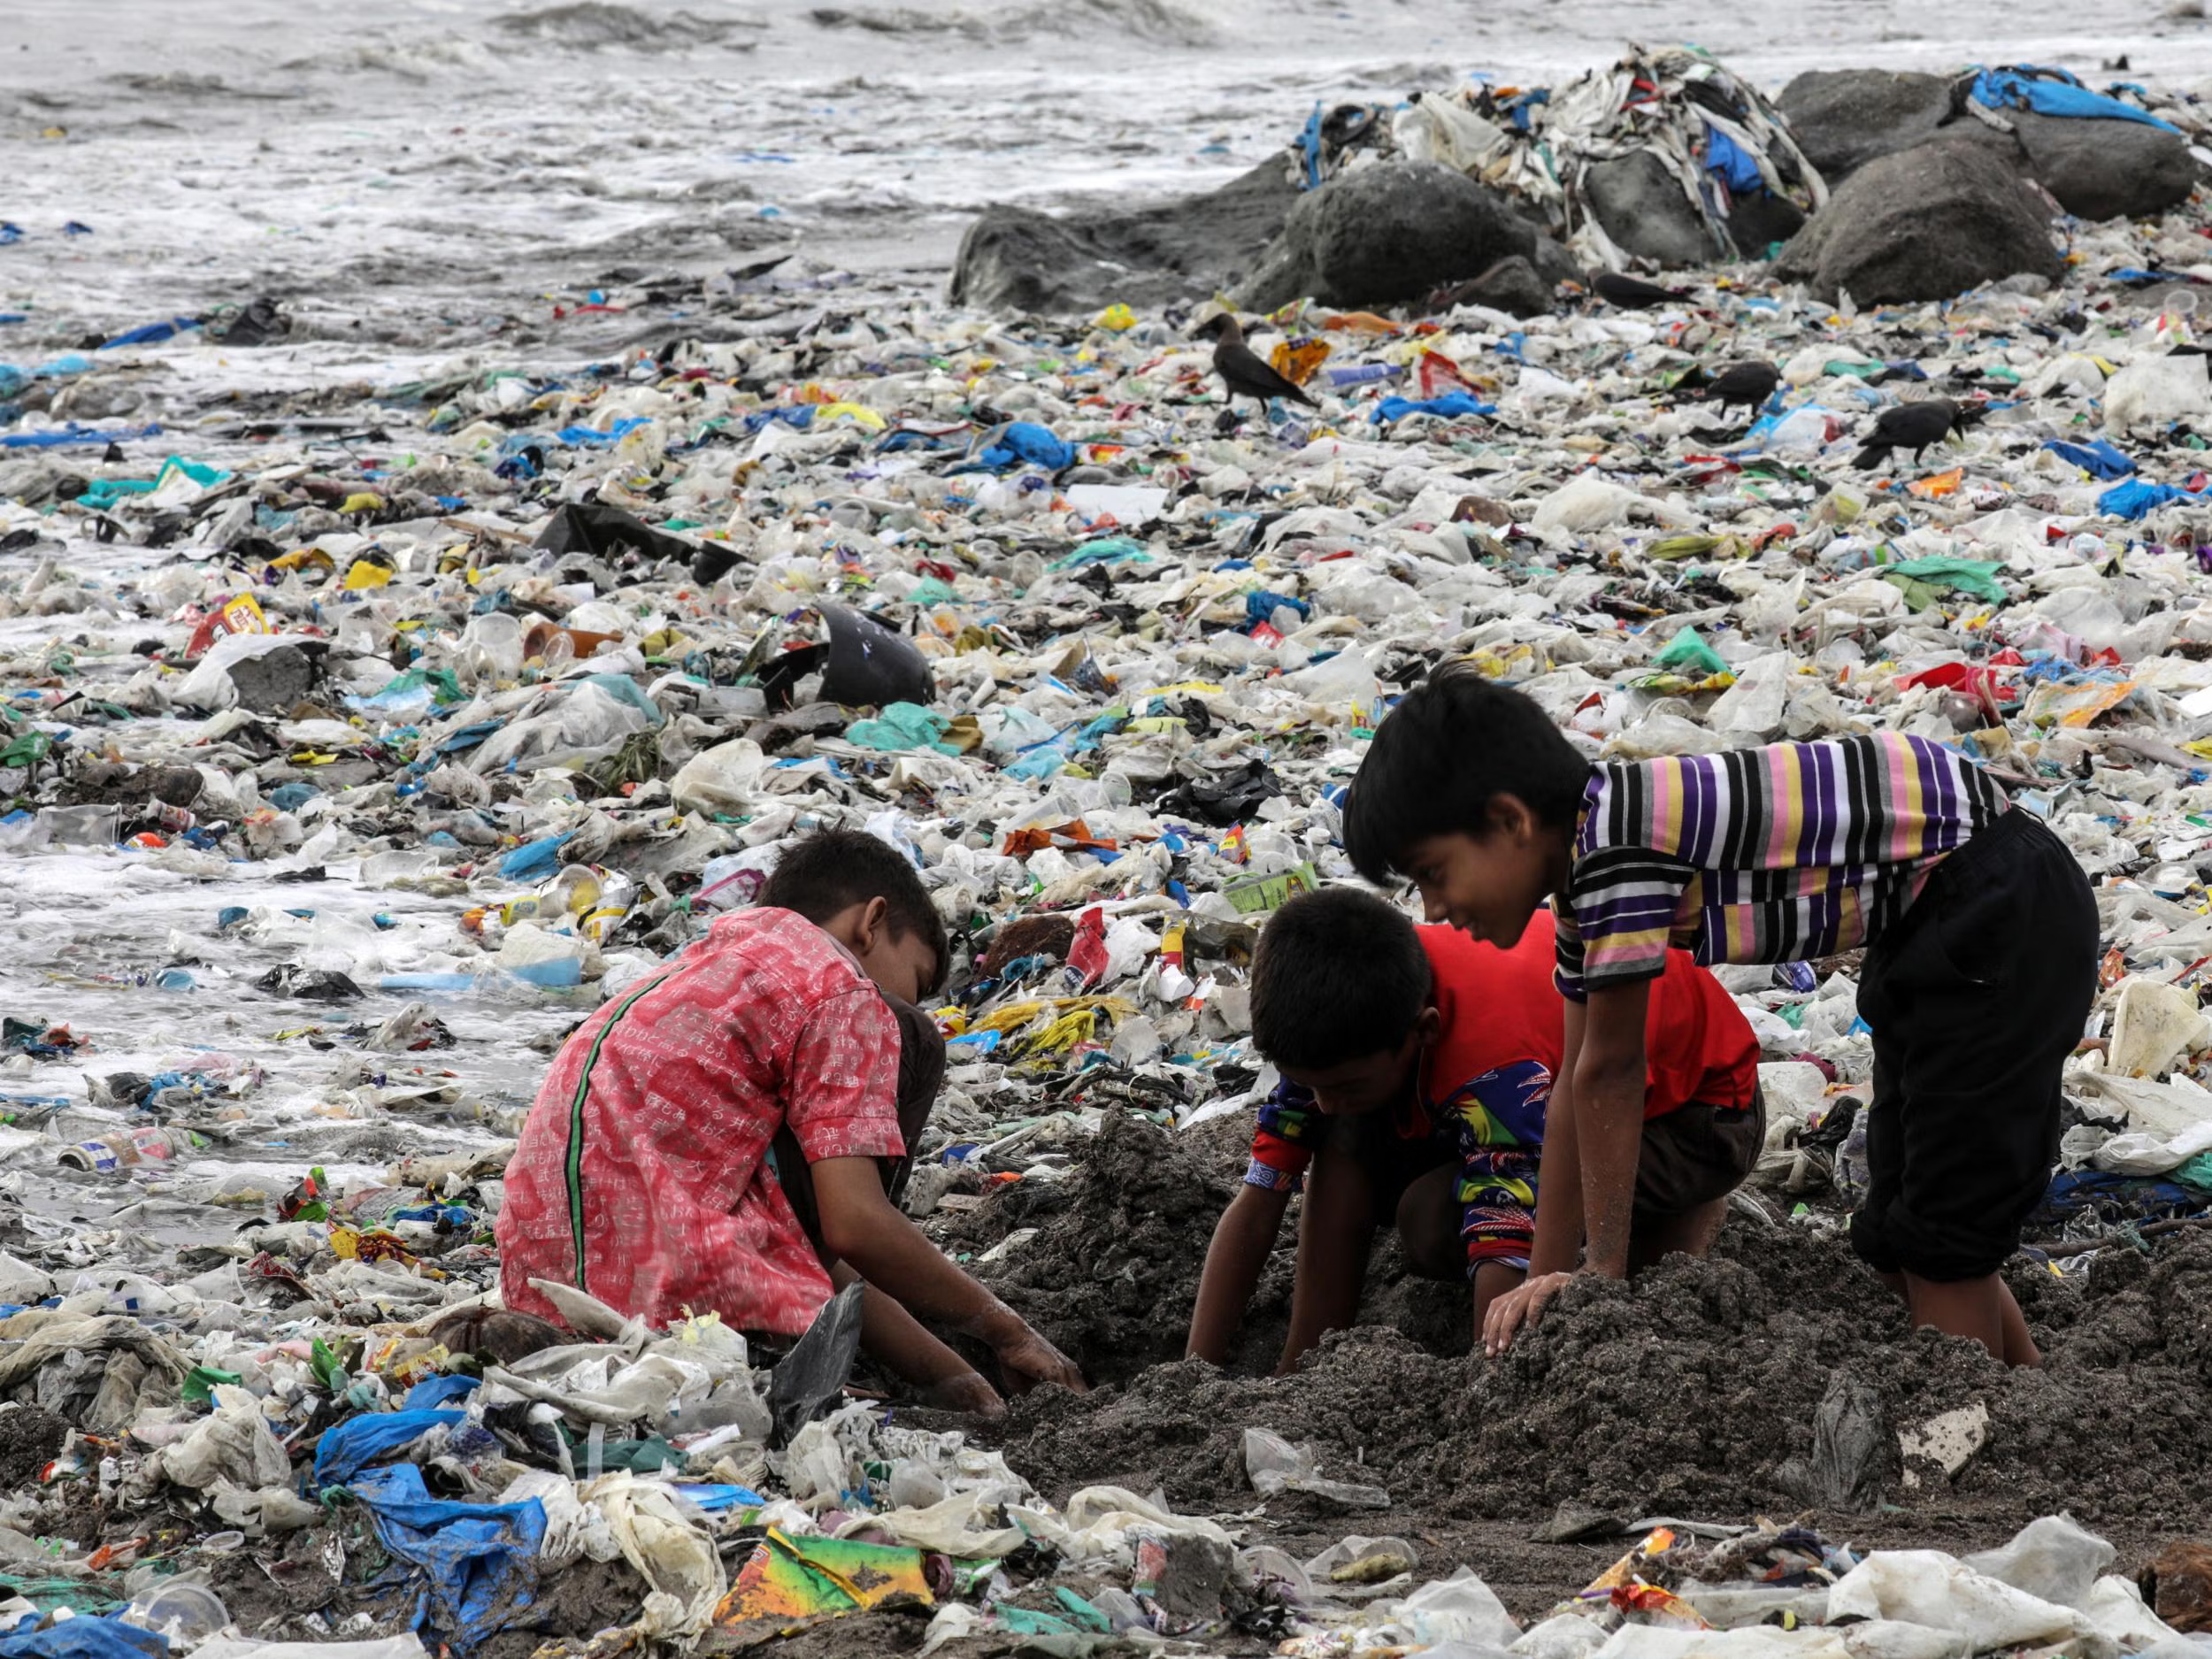
As marine litter worsens across the world, litter accumulation poses significant cyclical health, biodiversity, and climate risks. For example, an estimated 11 million metric tons of plastic waste enter the ocean every year, and this number expected to triple by 2040. Particularly in developing countries with lacking waste disposal systems and recycling programs, litter accumulation poses a much steeper issue that is often difficult to solve systemically. This often disproportionately impacts vulnerable coastal dwellers and fisherman who heavily rely on the marine ecosystem.
The trilateral partnership program, Urban Ocean, has been developing initiatives that mitigate marine pollution, assess waste management, and enable cities to address ocean plastics and resilience. While Urban Ocean’s zero-waste pilot have made strides in reducing marine litter, there persists difficulty in site-selection of pilots due to lacking litter information. This adds unnecessary barriers to the siting of pilot zero-waste pickup programs. By leveraging geospatial machine learning, this practicum project aims to explore how best to navigate zero-waste siting in areas facing bleak marine litter conditions.
Our resulting dashboard aims to support the narrative-building and decision-making of zero-waste pilots and attract funding sources and other support for these cities.
Project Use Case: A web-based dashboard with litter data metrics, demographic metrics, and a litter accumulation risk site-selection tool serving the 12 urban ocean cities in siting zero-waste pilots.
Analysis
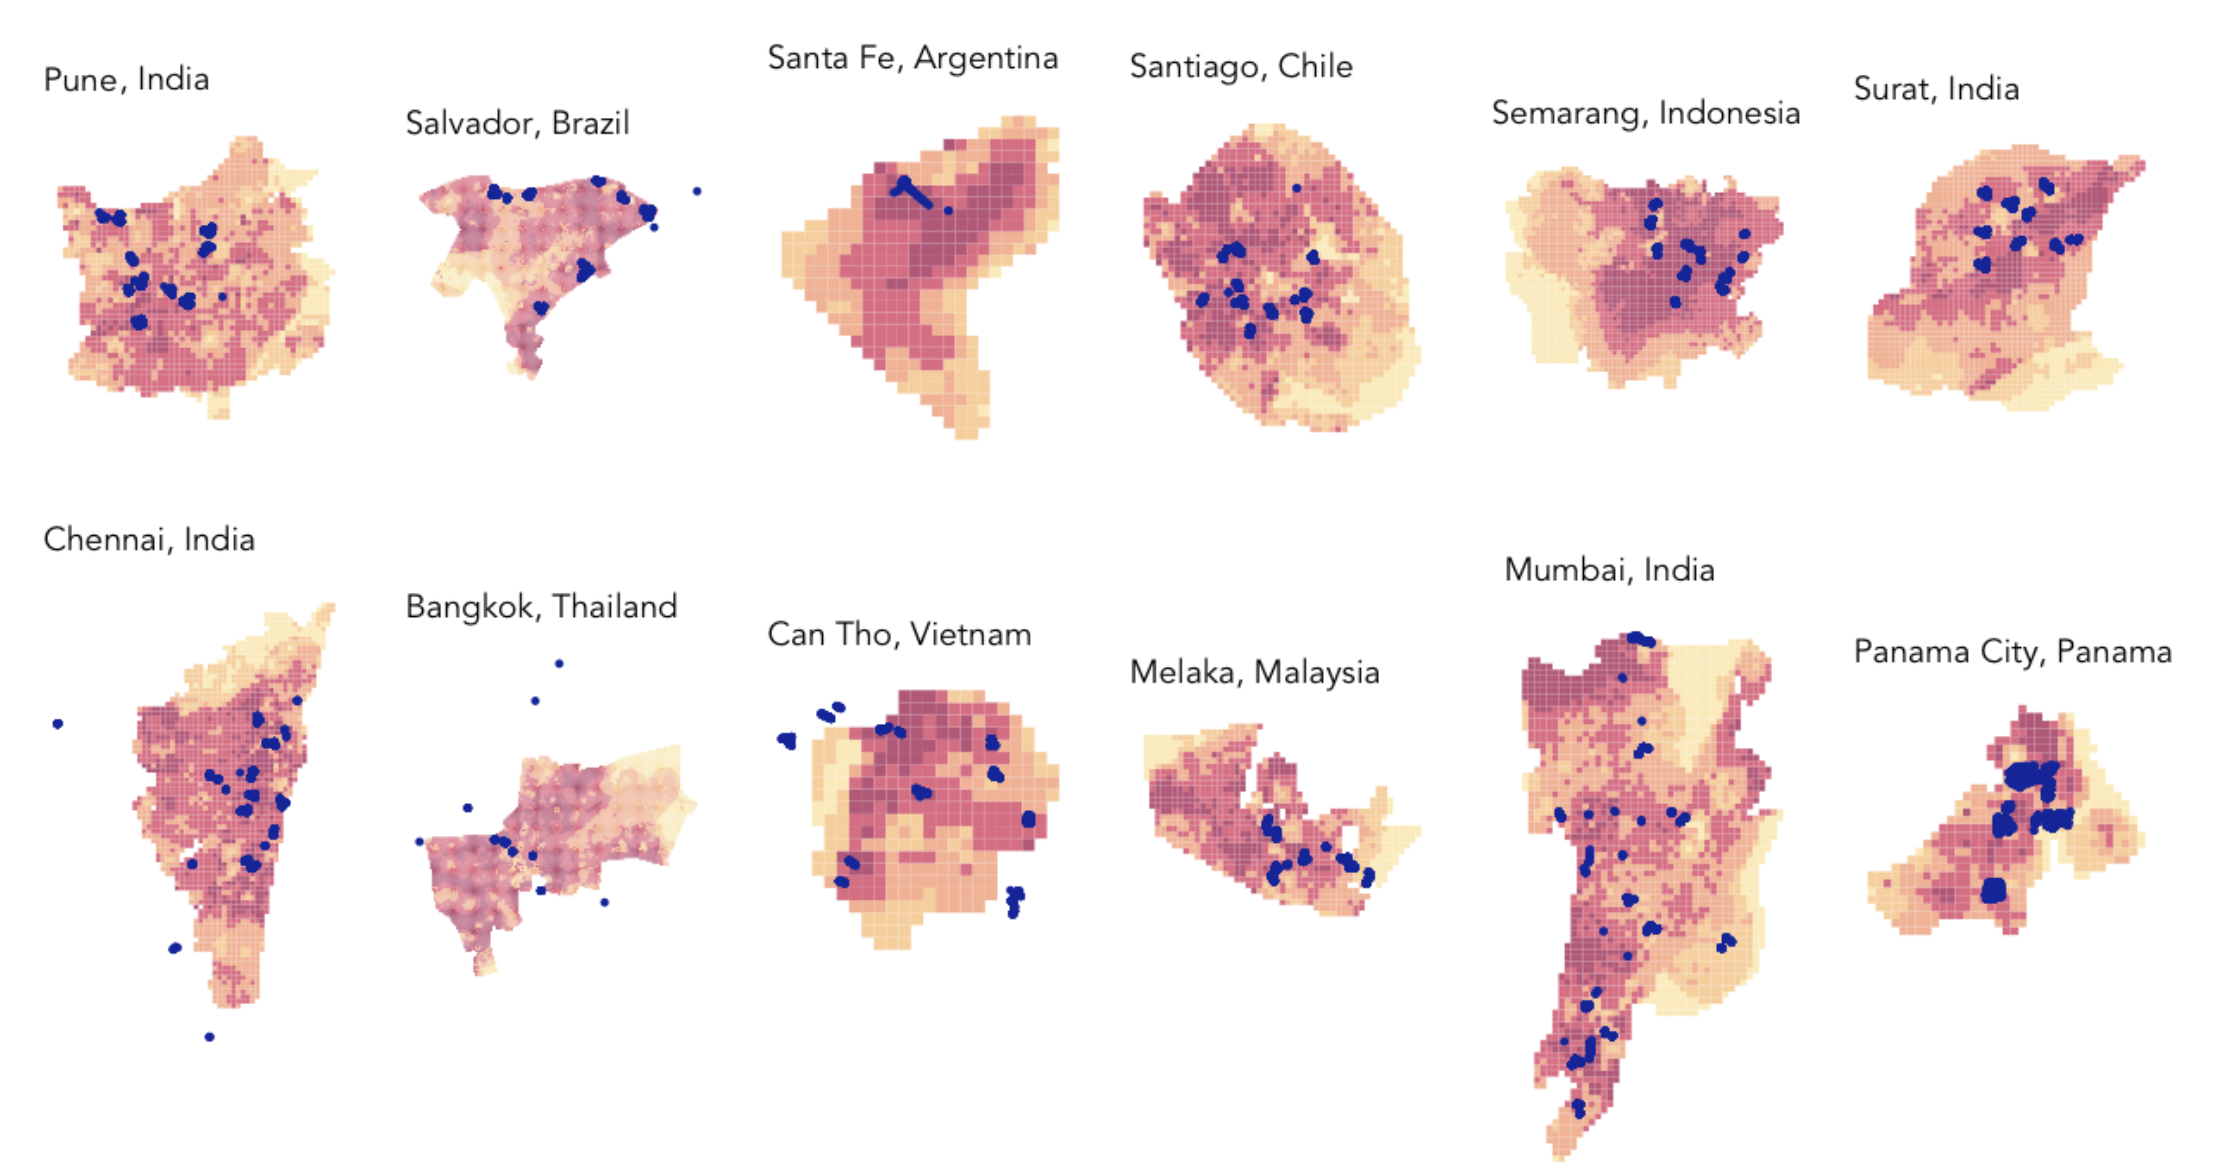
In our analysis, we examined a range of datasets to support our model building. Ultimately, we decided to opt for global datasets only, to ensure scalability across the Urban Ocean cities we were testing for.
A fishnet grid was employed in this analysis to allow for the most effective modeling of risk. The grid was used to aggregate and visualize the litter data and other variables to create a uniformed data structure for each city.
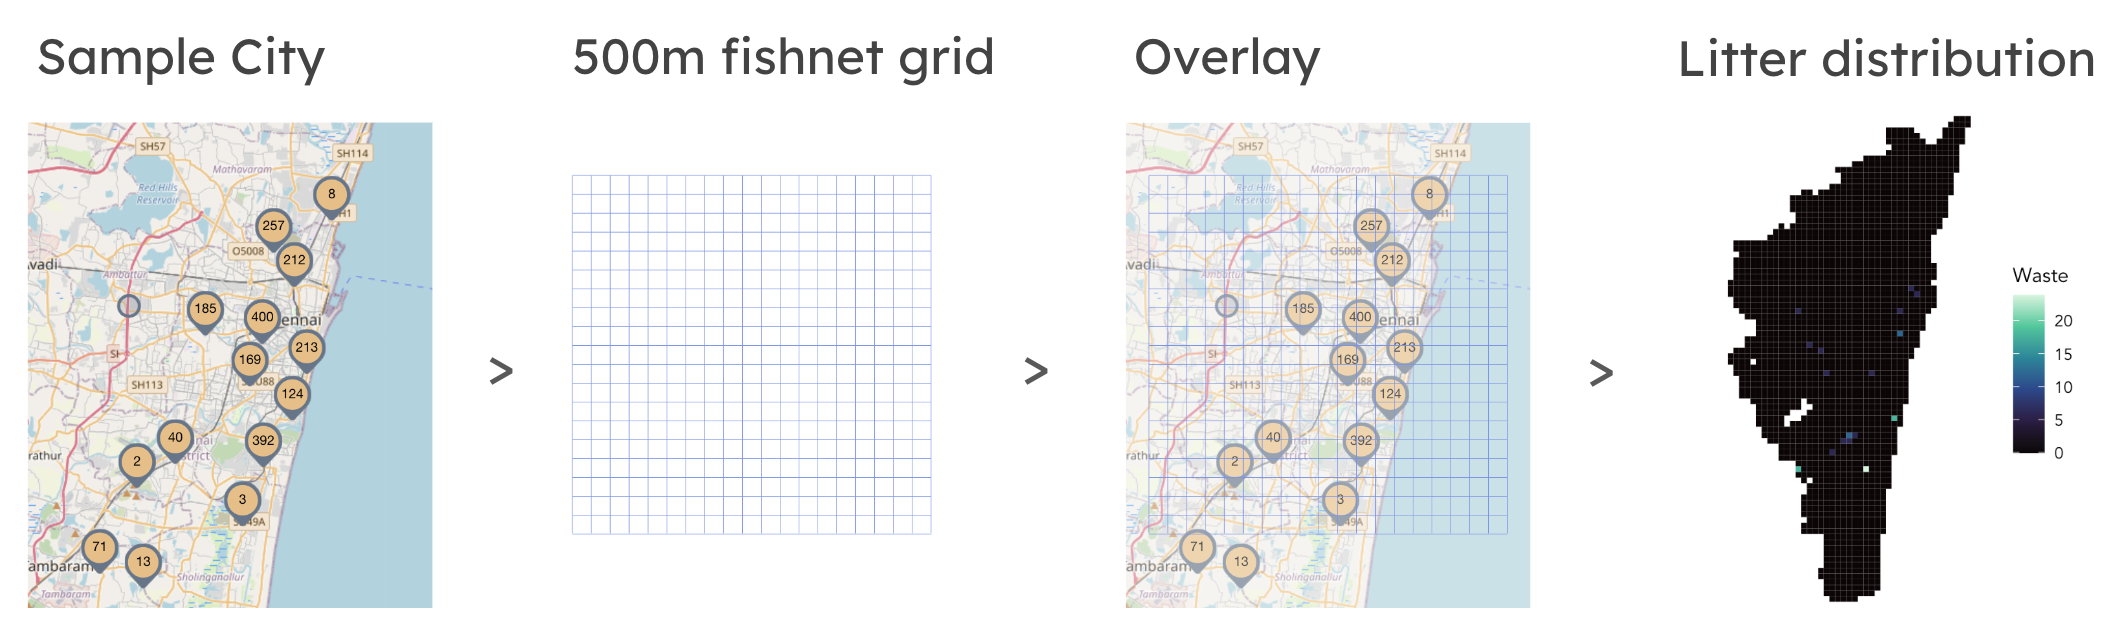
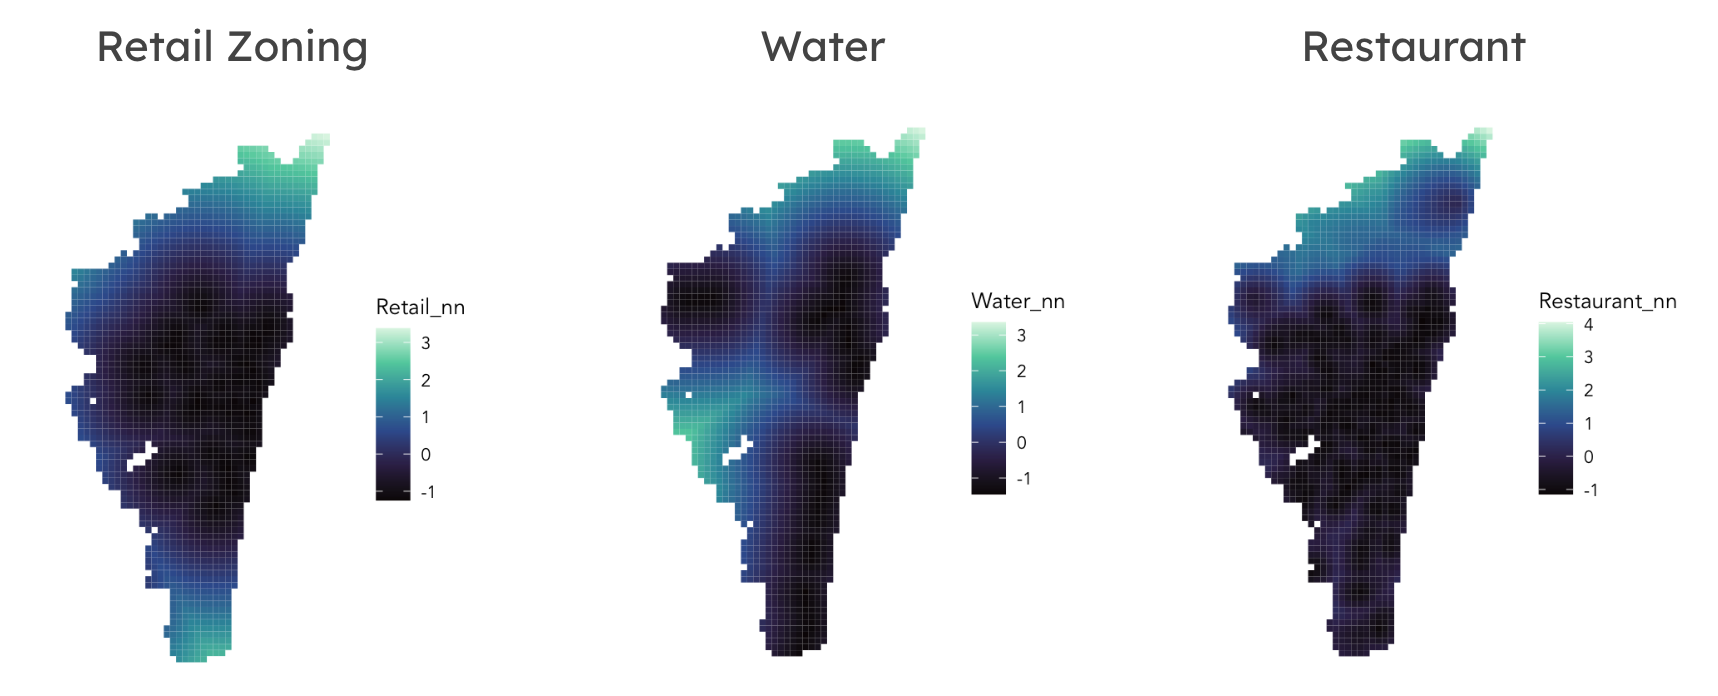
In addition to examining count across the fishnet analysis, we implemented a K-Nearest Neighbor analysis to determine the proximity of each data point to one another and incorporate that as an additional variable to our model. K-Nearest Neighbor (KNN) allows us to find the proximity of another variant to determine commercial/high activity spots in the area. The nearest neighbor factor was repeated for land-use, roads, restaurants, water, and waste facilities.
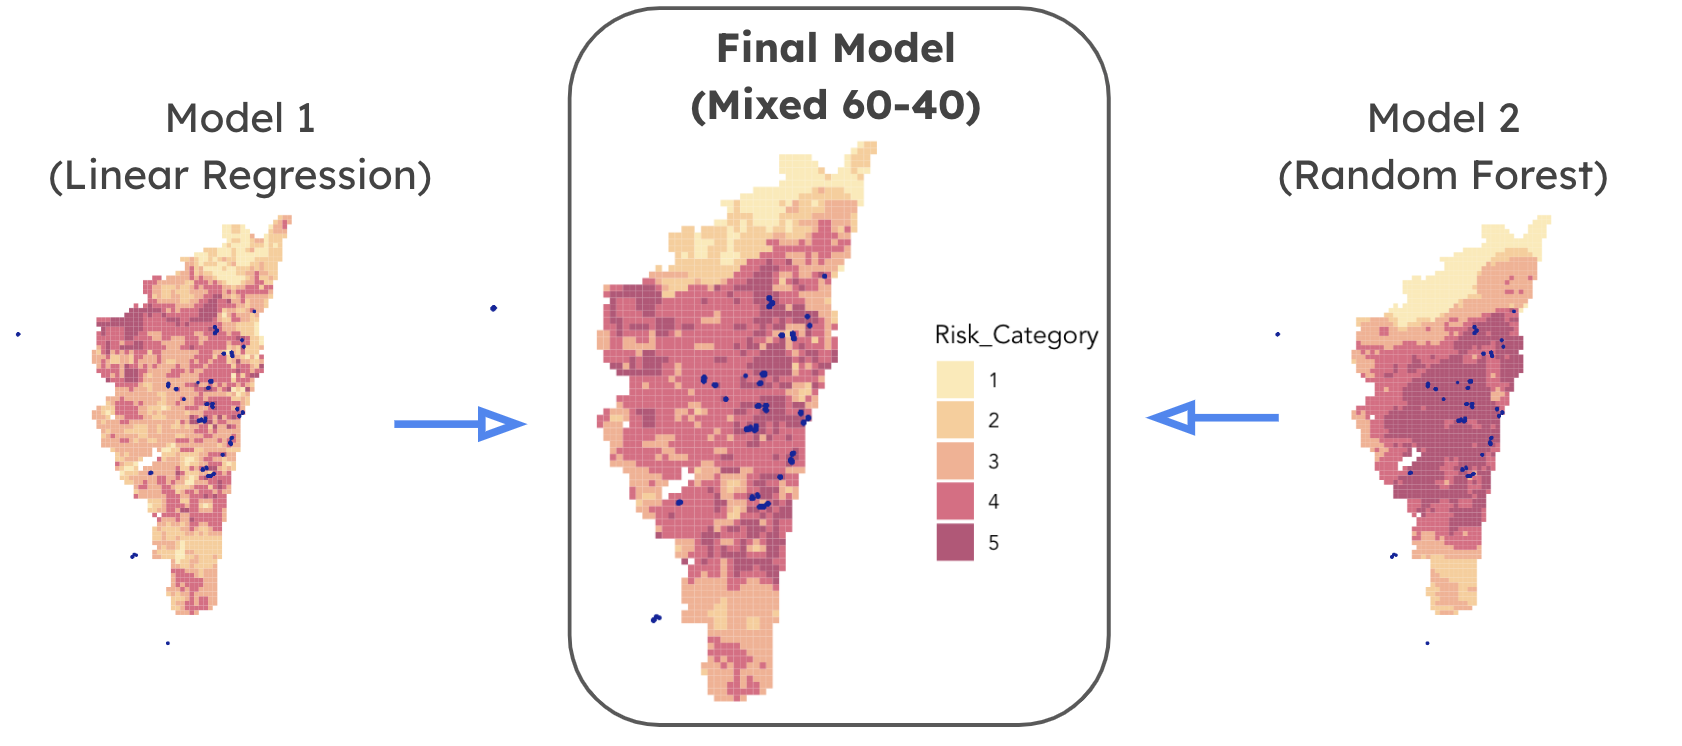
Ultimately created three regression models: a random forest model, a linear regression model, and a “mixed” model that combined the two. We found our mixed model the best for our use case with regards to residual error when comparing predicted to observed results.
Project Outcomes

![]()
Our model and web dashboard is the outcome of months of data research, wrangling, and iterative modeling and web application designing. Data processing, particularly given the level of bias, was difficult. However, by incorporating a range of international datasets, using data proxies, and feature engineering, we managed to produce a mixed random forest/linear regression model that decreased residual error and produced actionable insights into litter risk. We are eager for our project to be utilized for international use across cities to combat litter issues and support the resilience and sustainability of the Urban Ocean cities. See more in the below litter risk assessment dashbaord and full analysis.
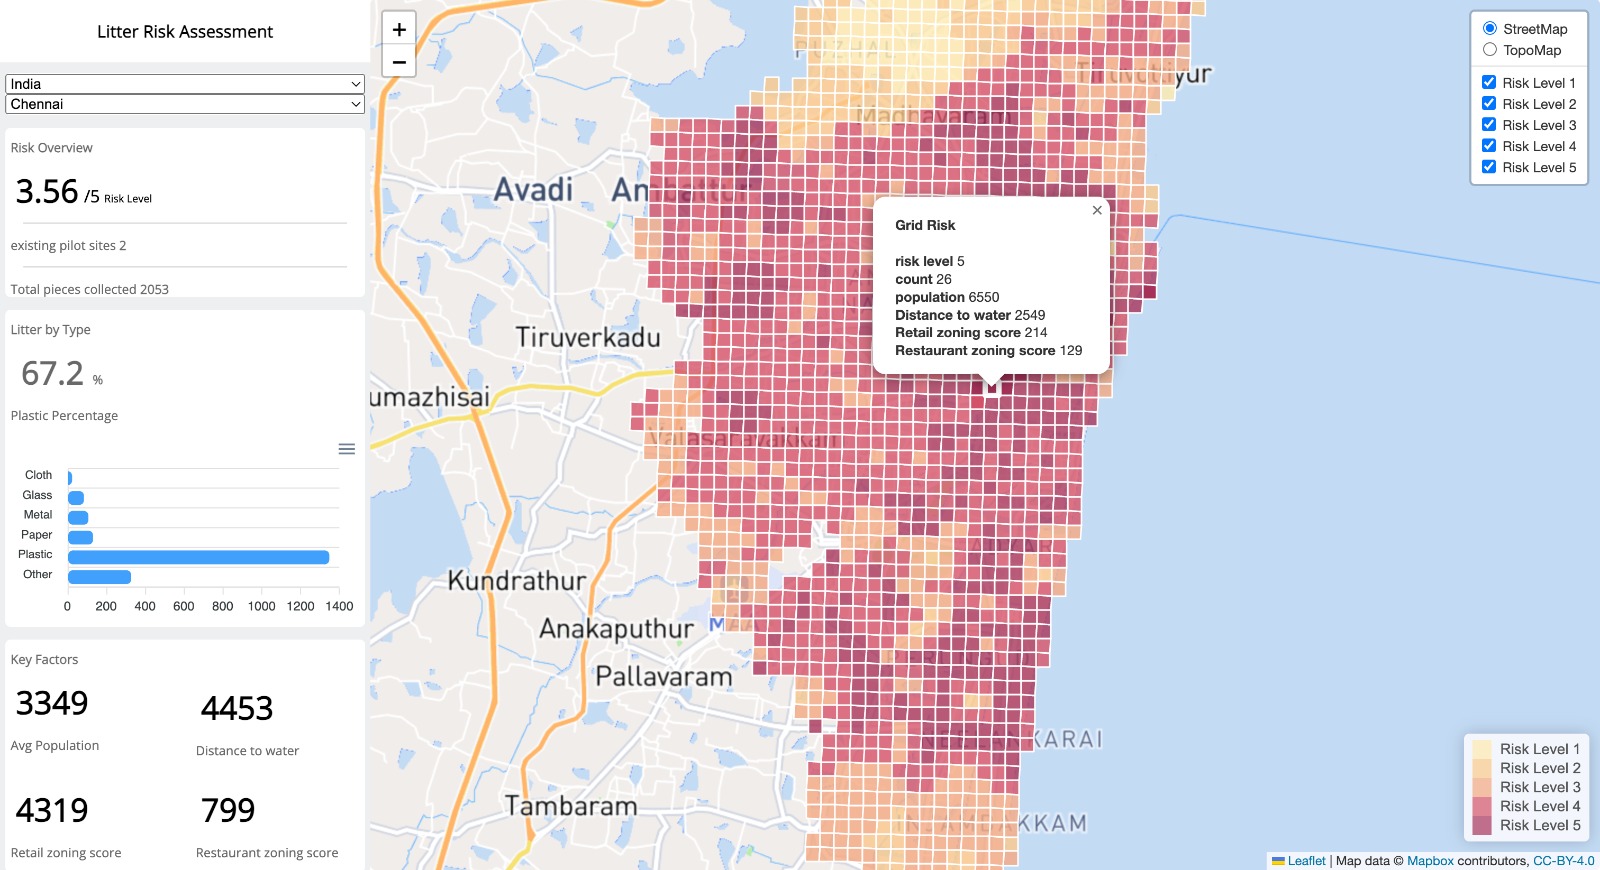
Litter Risk Assessment Dashboard
This is a preview. Please click the link below.
Our web-based dashboard, the Marine Litter Assessment Dashboard, visualizes our model results and other data analysis in an interactive way. Explore the risk assessment of the different Urban Ocean cities in the dashboard.
Full Analysis
Click into the full analysis to view at full screen.